| 2019 | 2018 | 2017 |
| SALES HIGHLIGHTS |
|---|
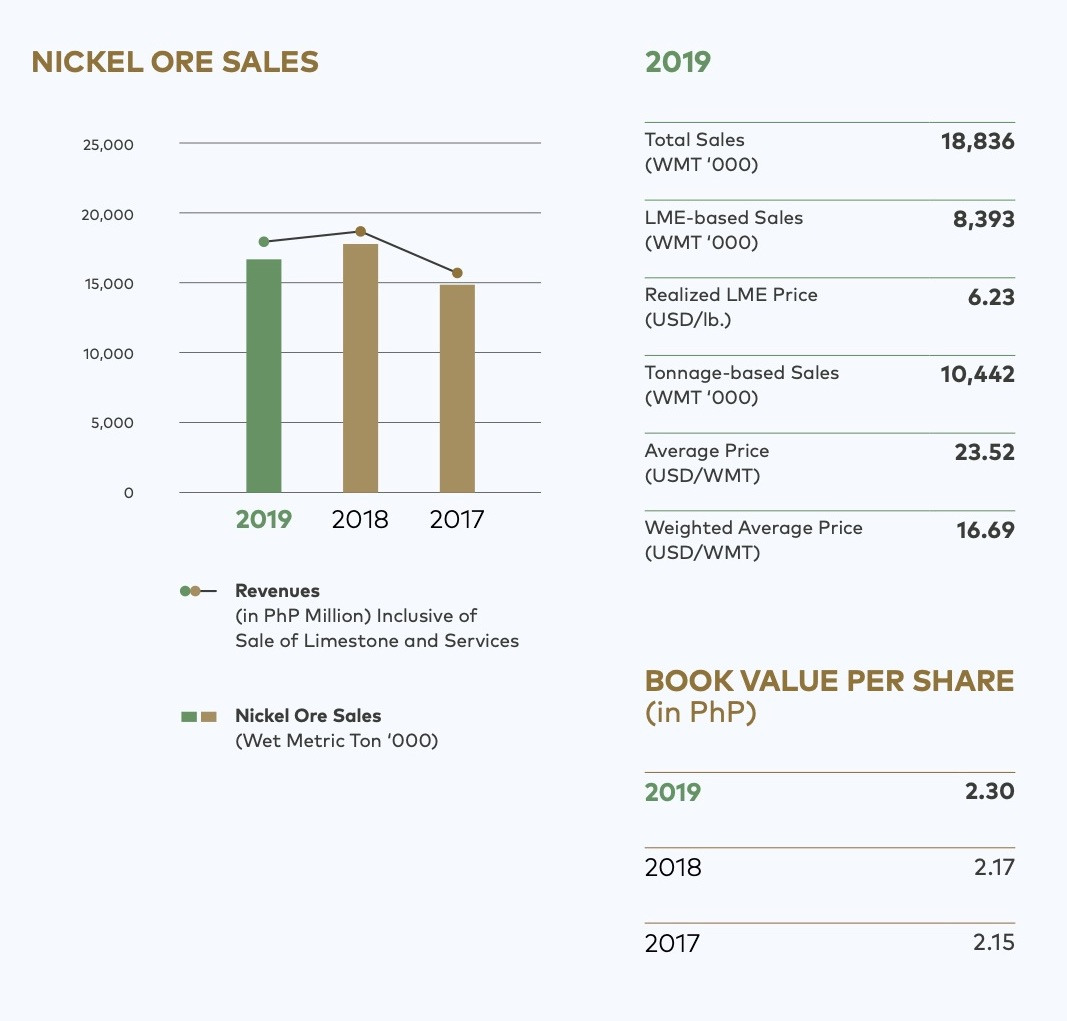
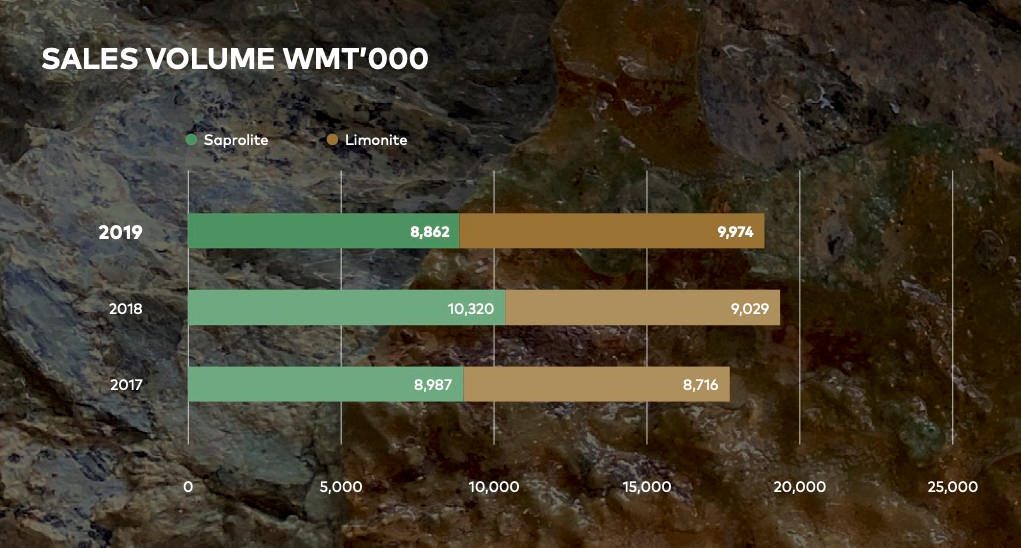
| Total Sales (WMT ‘000) | 18,836 | 19,349 | 17,703 |
| LME-based Sales (WMT ‘000) | 8,393 | 7,808 | 8,062 |
| Realized LME Price ($/lb.) | 6.23 | 5.95 | 4.67 |
| Tonnage-based Sales (WMT ’000) | 10,443 | 11,541 | 9,640 |
| Average Price ($/WMT) | 23.52 | 21.53 | 24.42 |
| Weighted Average Price ($/WMT) | 16.69 | 16.86 | 16.17 |
|
| FINANCIAL HIGHLIGHTS (PHP Millions, except Per Share amounts) |
|---|
| Sale of ore | 16,670 | 17,742 | 14,897 |
| Services and Others | 1,253 | 906 | 842 |
| Total Revenues | 17,923 | 18,648 | 15,739 |
| Operating Costs And Expenses | 12,779 | 12,608 | 10,474 |
| Net Income | 3,826 | 4,223 | 3,854 |
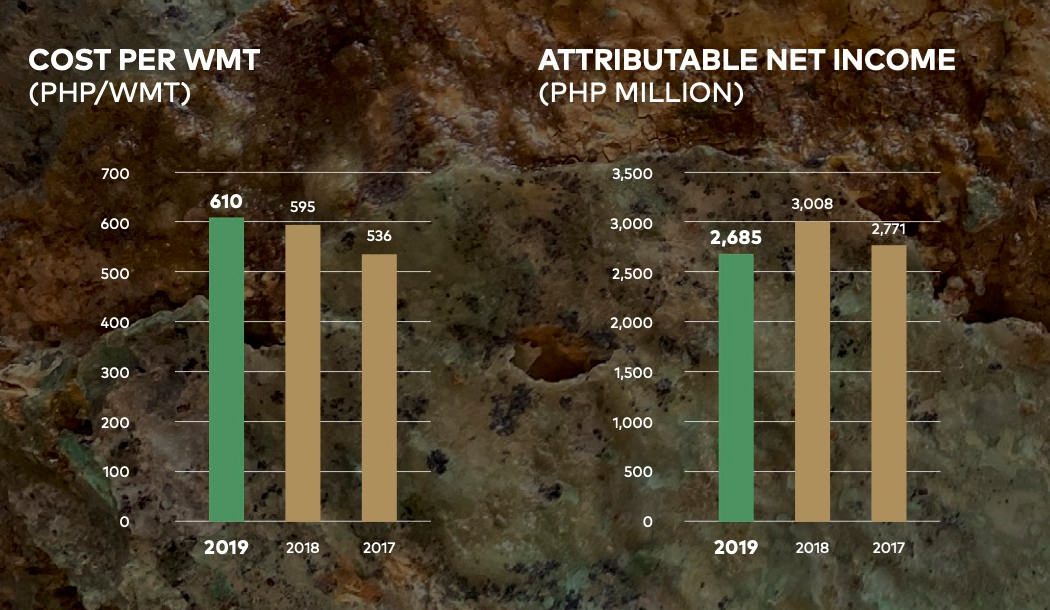
| Attributable to Equity Holders of the Parent | 2,685 | 3,008 | 2,771 |
| Attributable to Non-Controlling Interests | 1,141 | 1,215 | 1,083 |
|
| BASIC EARNINGS PER SHARE (PHP) | 0.20 | 0.22 | 0.20 |
|---|
|
| FINANCIAL CONDITION |
|---|
| Cash, Cash Equivalents and AFS Investments | 16,569 | 15,931 | 16,304 |
| Other Current Assets | 5,454 | 5,966 | 5,327 |
| Noncurrent Assets | 26,239 | 24,136 | 24,106 |
| Current Liabilities | 9,921 | 9,866 | 9,614 |
| Noncurrent Liabilities | 3,210 | 2,716 | 2,905 |
| Equity | 35,131 | 33,451 | 33,218 |
|
| BOOK VALUE PER SHARE (PHP) | 2.30 | 2.17 | 3.87 |
|---|